 •
08/04/2023
•
08/04/2023
“Executives speak three languages: finance, finance and finance.”
– Jeff Hiatt, Prosci Founder
In the world of customer experience, speaking the language of finance can be a challenge. CX leaders often focus solely on survey metrics, neglecting to include crucial financial information. However, if we want to truly impress executives and demonstrate the value of our efforts, we need to learn the language of finance.
Because executives are more interested in outcomes than survey scores. They want to see tangible results that have a direct impact on the bottom line. Few executives’ success is judged on survey scores. They’re judged on outcomes, and those outcomes often have dollars attached to them. That’s why revenue-related metrics are so important.
One key reason is that we don’t often include financial information in our survey platform, which restricts us to discussing survey metrics. And no matter how compelling the survey data is, it’s still survey data – not finance.

Now, let’s talk about which financial outcomes to focus on. While costs are interesting to most, I find executives are most compelled when I discuss revenue-related metrics. Most executives (especially in sales and marketing, but also CEOs) get more excited about increasing revenue than decreasing costs, making this a good place to start.
In my book, Do B2B Better: Drive Growth through Game-Changing Customer Experience, I discuss multiple revenue-based metrics you can use, including Customer Lifetime Value, Order Velocity, and Annual Recurring Revenue. But one metric stands out above the rest – Net Revenue Retention (NRR).
Net Revenue Retention (NRR) rate, also known as Net Dollar Retention (NDR), is the percentage of recurring revenue retained from existing customers in a defined time period, including expansion revenue, downgrades, and cancels. It measures the customer experience health of an organization and is a key performance indicator for subscription-based businesses. A high NRR rate indicates that your customers are happy, engaged, and loyal to your products or services.
Calculating NRR requires insight into both gross revenue and net revenue. Gross revenue includes new customers acquired in a given period, as well as customers renewing their subscription. Net revenue is the sum of all customer revenues minus cancellations and downgrades.

Net Revenue Retention is an important metric for any business to understand in order to gain insight on how well they are doing in terms of customer lifetime value and overall growth. The net retention rate, or the fraction of customers who continue to spend money with a company over time, is a key indicator of the health of a business. It is calculated by subtracting lost revenue from existing customers from total revenue earned. A high net retention rate is typically seen as an indication of a healthy, growing customer base, while a low net retention rate can indicate that the business may not be retaining its customers effectively.
By tracking this metric, businesses can measure customer loyalty and assess their ability to attract new customers and monetize existing ones. This helps companies better understand their customers’ needs and preferences so that they can make more informed decisions about product offerings, pricing strategies, customer experience, marketing campaigns, and other initiatives that drive growth. Additionally, it helps businesses measure the impact of changes to their business models on customer retention and identify areas for improvement.
Net Revenue Retention is an effective metric to gauge overall customer experience health, and should be used in conjunction with other customer experience metrics to gain a holistic view of the customer journey. Having an understanding of this metric is essential for businesses to increase customer loyalty and ensure long-term growth.
By tracking Net Revenue Retention, companies can make strategic decisions that will have a positive impact on their customer experience and ultimately lead to increased customer loyalty and profitability.

To calculate NRR, you must first assess gross retention rate – which captures the customer’s willingness to stay on board with your product or services – then subtract any expansion revenue from the total net revenue. Expansion revenue is the additional revenue you receive when customers upgrade their subscription. The result is your NRR rate, which gives an indication of how well customers are responding to changes in the business.
Knowing your NRR helps you identify customer experience areas that need improvement and can inform strategies for keeping existing customers happy. Ultimately, focusing on improving both retention and expansion will help drive long-term customer loyalty and satisfaction.
Another way to calculate Net Revenue Retention – or Net Dollar Retention – is to combine recent customer retention with sales volume, excluding new customers’ sales. The Net Revenue Retention formula is:
Number of last year’s customers renewing this year × Average spent this year
Number of customers last year * Average spent last year
Let’s look at an example at Net Revenue Retention measures. Last year, you had one hundred customers who spent $1,000. This year, you lost five customers, but revenue remained consistent. Your NRR calculation would be 95%, showcasing the impressive retention rate of your customer base. Note that new customers don’t factor into this, only your existing customer base; this is strictly about retention.
95 customers (this year) × $1,000 = $95,000
100 customers (last year) × $1,000 = $100,000
But NRR doesn’t stop there. It also takes into account upsells and additional revenue generated from existing customers. Imagine you up-sell your remaining 95 customers by $100 on average, increasing your NRR to 104.5%. In that case, the calculation is:
95 customers (this year) × $1,100 = $104,500
100 customers (last year) × $1,000 = $100,000
Net Revenue Retention takes into account customer churn, while Gross Revenue Retention does not. Net Revenue Retention is the most accurate measure of a company’s retention rate because it gives an indication of the actual amount of money retained from existing customers over time. By tracking this metric and identifying any issues in customer satisfaction, businesses can take steps to improve their customer experience and ensure that they retain as many customers as possible.
By tracking customer retention metrics such as Net Revenue Retention, businesses can get a holistic understanding of their customer experience health and make informed decisions about how to better serve their customers going forward. With an accurate understanding of their customer base, companies can create personalized experiences that result in a high customer engagement and customer retention rate.
So why is NRR such a great measurement for customer experience across most industries? Because it directly reflects the impact of your efforts on customer retention and growth. While other metrics like new sales and referrals may be influenced by customer experience, they can be difficult to track and attribute directly. NRR, on the other hand, provides a clear and tangible representation of your success.
NRR directly represents the outcome of your customer experience. CX can certainly impact new sales, especially in terms of earning referrals. But few organizations track referrals in a systematic way. There are strong indirect impacts.
For example, one study showed that improved customer experience reduces the costs to sell; however, you’ll have a difficult time taking credit for that decreased cost to sell at your year-end review.
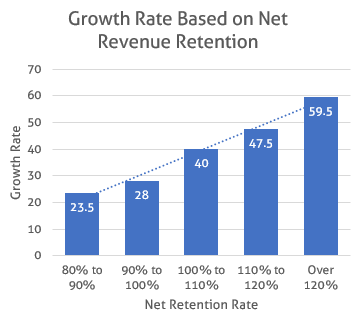
NRR doesn’t work for every business, though, such as health insurance companies that don’t offer many upsells. In this segment, it’s more effective to focus on retention only. However, NRR works well for most industries. Analysis by SaaS Capital shows a direct relationship for SaaS companies between NRR and growth, which makes sense. It’s hard to grow if you constantly need to replace your existing revenue.
Net Promoter Score (NPS) has traditionally been used to measure customer experience health. While NPS is useful in understanding customer sentiment, it does not provide a holistic view of the customer journey or an indication of how customers are interacting with the brand over time.
On the other hand, tracking Net Revenue Retention provides businesses with insights into how customers are engaging and spending with a company, which gives them an indication of the customer’s overall experience.
Net Revenue Retention is a metric that measures the amount of revenue a business retains from its existing customers over time. By analyzing this metric, businesses can get an accurate picture of how their current customers are interacting with the brand and which areas of the customer journey are working well.
This is especially important for businesses that rely on recurring revenue models, as tracking Net Revenue Retention rate gives them a better understanding of customer churn and loyalty over time.
With this information, businesses can gain a better understanding of their customer base and use it to inform their decisions going forward. By focusing on driving customer loyalty, companies can ensure that they remain competitive in today’s ever-evolving market.

I recommend that every customer experience leader adopt NRR as a primary metric and report on it regularly. Make it known throughout the organization and use it to showcase the value and impact of your efforts. Identify trends of the Net Revenue Retention rate and the investments in CX over time. By prioritizing customer retention and growth, you’ll position yourself as a true CX leader and drive meaningful results.
Measuring this metric regularly can help companies identify areas where they excel and areas that need improvement, helping them create more tailored experiences for their customers. By doing so, businesses can drive loyalty and long-term revenue growth.
So, if you’re ready to take your customer experience to the next level, embrace the language of finance and start measuring your success with NRR.
– Net Retention Rate is a key indicator of the health of a business and is calculated by subtracting lost revenue from existing customers from total revenue earned.
– By tracking this metric, businesses identify trends of the Net Revenue Retention rate and the investments in CX over time. CX programs can measure customer loyalty, retain customers, and assess their ability to attract new customers and monetize existing ones.
– Net Revenue Retention should be used in conjunction with other customer experience metrics to gain a holistic view of the customer journey
– Identify trends of the monthly recurring revenue, Net Revenue Retention, revenue churn rate, and the investments in CX over time.
– Make NRR a primary metric and report on it regularly to showcase the value and impact of CX efforts.